


Main Package Functions
This package contains the functions necessary to compute Kernel Linear Regression (KLR) on mean kernel embeddings, functions for preparing site and background data, and a function for simulate archaeological site location data.
KLR_funs.R for Fitting and Predicting on Tabular Data
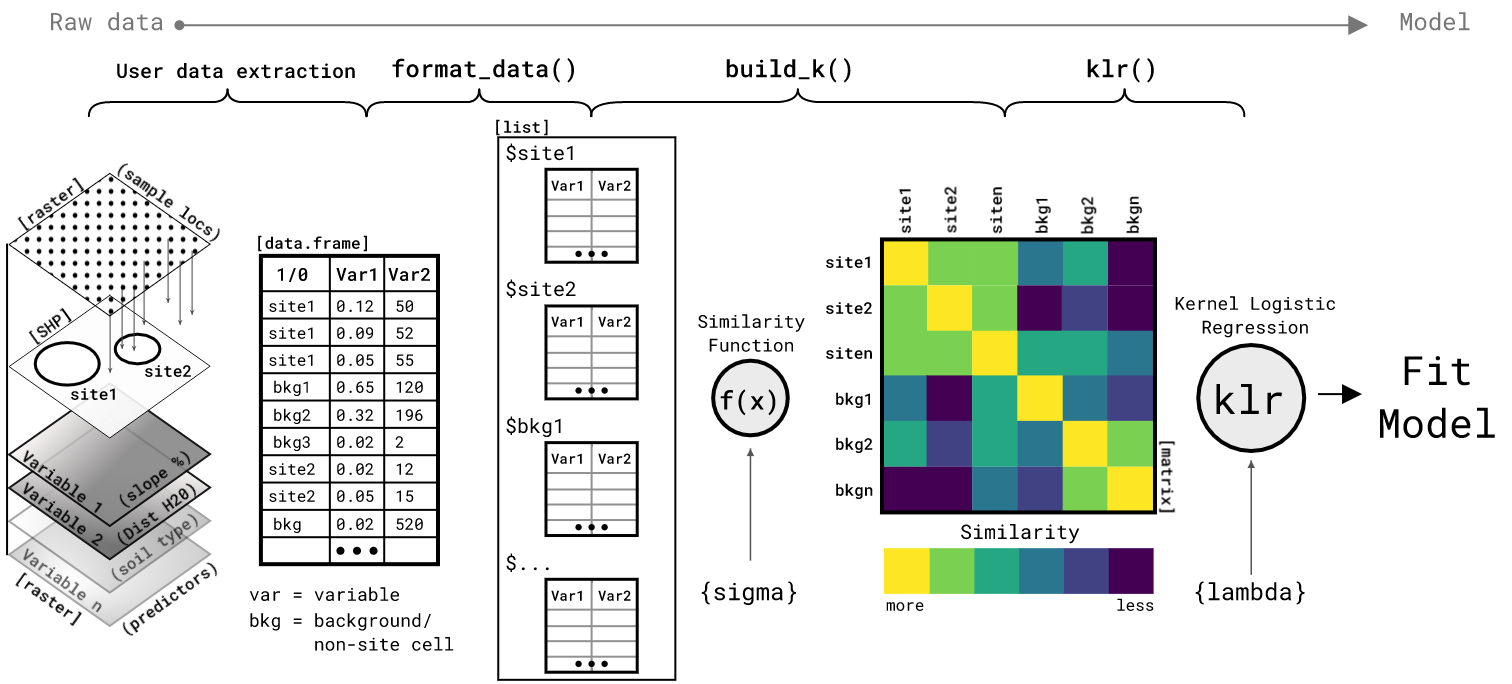
build_K- Function takes list of training data, scalar value forsigmahyperparameter, and a distance method to compute a mean embedding similarity kernel. This kernel is a pair-wise (N x N) matrix of the mean similarity between the attributes describing each site location and background group. Optional inouts areprogressfor a progress bar anddist_metricfor the distance computation. By default, the distance metric iseuclideanand should likely stay as such unless you have explored other distances and know why/how you want to use them.KLR- Function takes the similarity kernel matrixK, a vector of presence/absence coded as1or0, and a scalar value for thelambdaregularizing hyperparameter; optionally values for maximum iterations and threshold. This function performs Kernel Logistic Regression (KLR) via Iterative Re-weighted Least Squares (IRLS). The objective is to approximate a set of parameters that minimize the negative likelihood of the parameters given the data and response. This function returns a list ofpred, the estimated response (probability of site-presence) for the training data, andalphas, the approximated parameters from the IRLS algorithm.KLR_predict- Function takes a list of the training data, a list of the testing data, a vector of the approximatedalphasparameters, a scalar value for thesigmakernel hyperparameter, and a distance method. This function predicts the probability of site presence for new observations based on the training data andalphasparameters. This is accomplished by building thek*kkernel matrix as the similarity between the training test data then computing the inverse logit ofk*k %*% alphas. The output is the predicted probability of site presence for each training data example.
raster_predict_funs.R for Predicting on Raster Data
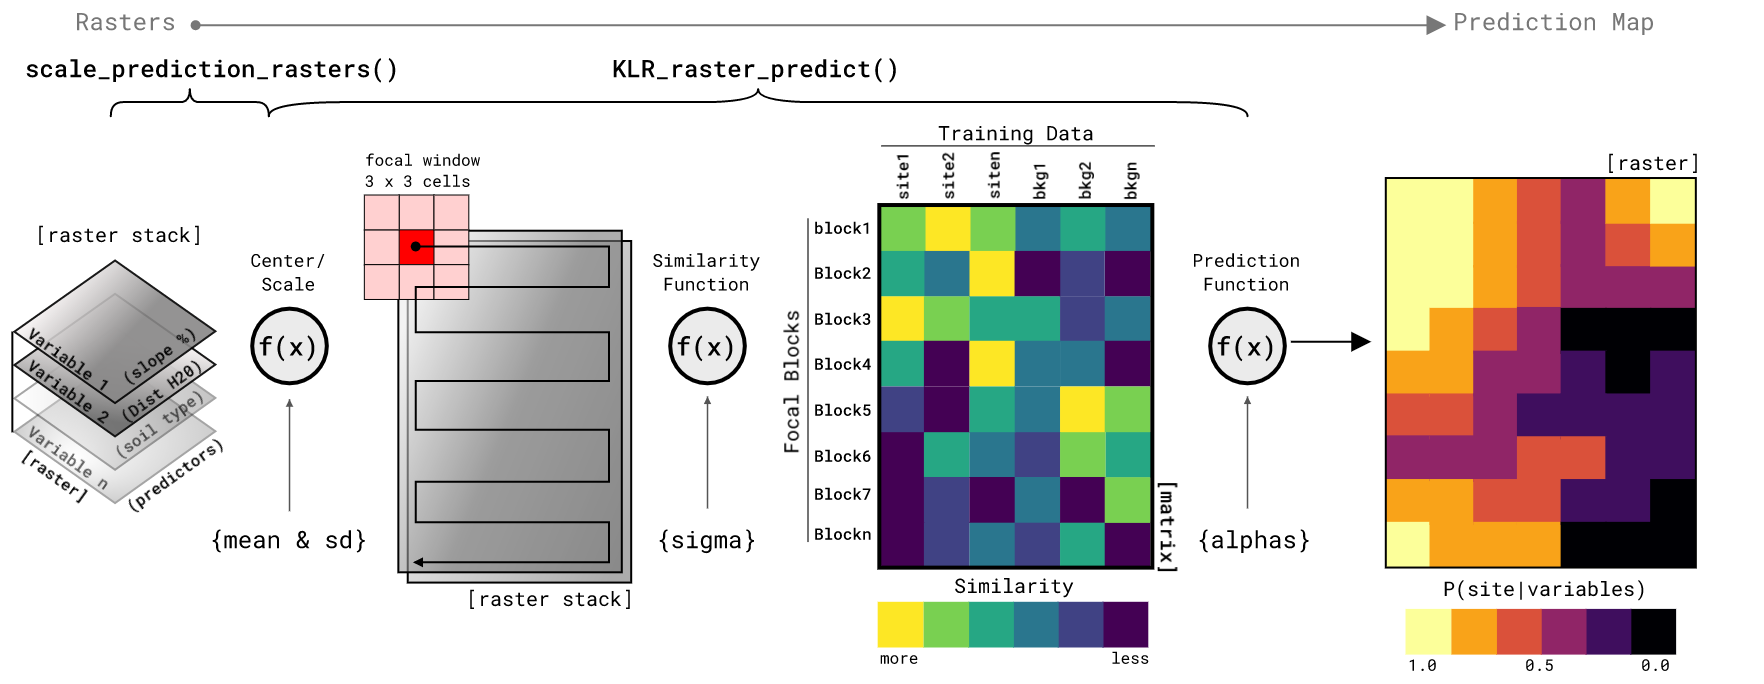
rescale_sim_raster- Function that rescales simulated rasters fromNLMR::nlm_gaussianfield[@NLMR] or whatever you want to use, to the mean and standard deviation of the simulated data used to fit theklrmodel. You will have to add themeanandsdarguments manually based on what you put into theget_sim_datafunction. The example in the code above inputs the defaultmeanandsdvalues from the defualts of theget_sim_datafunction. Returned is a raster scaled too your simualted training data.sim_trend- Function is used to take creatennumber of simulated site locations ofsizecell dimensions on arowsbycolsraster. The latter two arguments should match the size of your simulated rasters. The function randomly locates the sites and then creates a distance gradient (trend) from the site locations outward. The trend is a value1at the sites and reduces to0at the maximum combined distance from all sites. The output of this function is alistof amatrixof simulated site x/y coordinates (centers) and arasterof the trend surface. The point of the trend is to then combine it with the simulated rasters (as down in the code above) such that the raster depicting site-likely conditions is multiplied by the trend to output a raster retaining site-likely conditions near simulated site locations. Conversely, the site-unlikely simulated raster is multiplied by the inverse of the trend to result in a raster retaining site-unlikely characteristics away from the site locations. When those two rasters are added you get a simulated environment that is more preferable to site locations near site locations. It is a bit involved for something that had nothing to do with the actual KLRfome model, but it is needed to produce actual correlated environments for model testing.scale_prediction_rasters- Function scales your predictorrater stackbased on theparamslist created in the model fitting process. This script simply loops over the rasters in the stack and centers and scales based on mean and sd of the training data used to fit theklrmodel. The function outputs araster stack.KLR_raster_predict- Function predicts the probability of site-presence based on araster stackof center/scaled predictor rasters, a focal neighborhood size in cells asngb, and theparamslist of model fit parameters. Finally, the function also needs to the the number of columns ascolsand rows asrowsof the study areas raster stack. The rest of the arguments default to predicting the entire raster stack in one pass and only on a single core (not in parallel). The rest of the argument control whether the study area is split (split = TRUE) into a grid of blocks. Theppsidepositive integer controls the number of blocks along each axis of the study area. If you wish to compute the prediction in parallel, you will need to split it into blocks so that each block can be sent to a different processor core. The final set of optional arguments control how the prediction is returned, either as aoutput = "list"oroutput = "save"for returning a list of rasters of saving each out as a GeoTiff, and then arguments for the GeoTiff location withsave_locand whether to overwrite existing GeoTiffs withoverwrite. The function contains a bit of logic to try and assist the user in which arguments go with what. Perhaps future versions will streamline this a bit.
format_site_data.R for Data Formatting
-
format_site_data- Function takes adata.frameof presence/background observations. The columnpresenceindicated site presence of background as1or0respectively. TheSITENOcolumn indicates either a site identifier orbackground. The remaining columns should be measurements of environmental or cultural variables for modeling similarity. It is expected that each site will have multiple rows indicating multiple measurements of environmental variables from within the site boundary or land form. The function centers and scales the predictor variables, sub-samples the data into training and test sets, and re-formats the data as both tabular format and list format for both training and test data sets. Importantly, the function makes sure that no single site is in both the training and test set. No test sites are used to train the model. Also returned is the mean and standard deviation of the data so that new data can be center and scaled to the same parameters.
get_sim_data.R for Simulating Site Location Data
-
get_sim_data- Function takes a mean and SD for two simulated predictor variables for each of sites and background. With archaeological site data being a protected data set in many settings (including this project), it cannot be freely shared. However, it is difficult to implement this model without properly format data. This function simulates archaeological site data and background environmental data for testing or tuning of this model. The concept of the function is to simulate two predictor variables for both sites and background. The inputs to the function (defaults provided) control how similar or different the site data is from the background. The model can be tested on simulated site data that is very similar to the background or very different; the model behaves accordingly. The output of the function is formatted in the same way as theformat_site_datafunction.
metrics.R for Calculating Performance Metrics
CM_quads- Function takes a data.frame of predicted probabilities (must be calledpred) and actual observed presence/absence (must be calledpresenceand contain1 = presenceand0 = absence). Optional input is a threshold value or values in the form of a single scalar (default = 0.5) or a numeric vector to loop over. The function calculates the True Positive, True Negative, False Positive, and False Negative quantities at each threshold. These quantities are typically shown in a 2x2 confusion matrix, hence the name Confusion Matrix (CM) quadrants. The output is a data.frame with columns for theTP,FP,TN, andFNat each desiredThreshold. This is useful for figuring out how the model performs at a variety of thresholds. In the example code above I also compute theAUCstatistic that gives an indication of model performance across all thresholds.metrics- Function provides a large quantity of metrics based on the quadrants of the Confusion Matrix derived from a threshold of the predicted probability values. The input to this function is theTP,TN,FP, andFNquantities of a thresholded model as derived from theCM_quadsfunction. The output of this model is a list of51different metrics such asSensitivity,Youden's J,Positive Predictive Gain, and many more. Some are commonplace and others are practically unknown. I put a few note in the function as to where they come from. The function returns all51as a list.
plot.R for Plotting Similarity Kernel
-
K_corrplot- Function is a pretty simple wrapper aroundcorrplot::corrplot()with hierarchical clustering. Inputs for this function are the similarity matrixKand thetrain_datawith the option of an integer for the number of clusters to partition the data; default = 4. Output is a plot or if assigned to an object, it is an object of classmatrix.